AIF TOOL SUITE

One place to manage AI adoption.

Bring business, technology, and leadership teams together to manage AI opportunities, investments, and outcomes.

Build a shared system of record that preserves decisions, tracks value, and grows with your organization's AI adoption.

AI ADOPTION ACROSS YOUR ORGANIZATION

Build an AI adoption capability that scales.

The Tool Suite establishes a common, trackable workflow for AI adoption, bringing ideas and initiatives from across your organization into one clear view.

Business, technology, finance and leadership teams work together in a shared environment to assess opportunities, agree priorities and track outcomes.

It puts the Applied Intelligence Framework (AIF) into daily practice, helping your organization build a repeatable capability that grows with adoption.

  • Business
  • Technology
  • Finance
  • Leadership
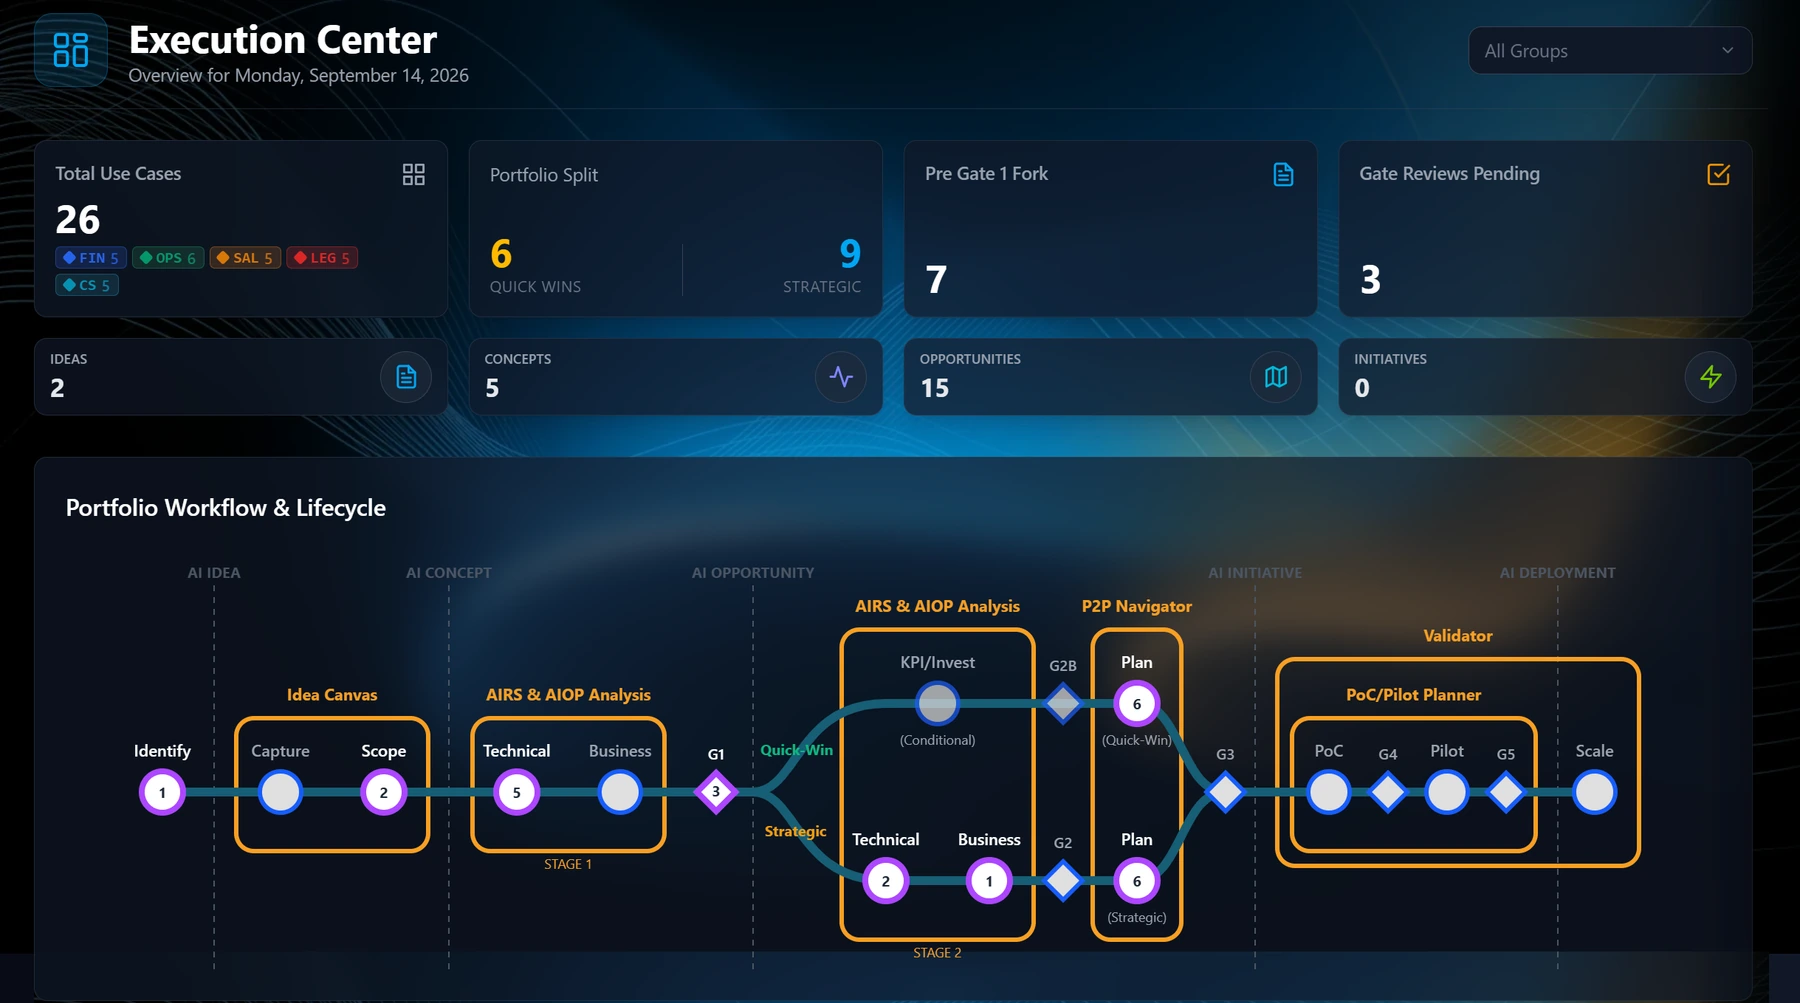
One shared system of record connects business, technology, finance and leadership through a common, trackable workflow. The original Execution Center product view below shows demonstration data.
Execution Center showing portfolio status, pending reviews and the connected workflow from AI idea through assessment, planning, pilot and deployment.

Scroll to explore the full workflow.

  • See the whole picture

    Understand which ideas are emerging, where initiatives stand and which decisions need attention.

  • Align people and decisions

    Bring stakeholders together around consistent criteria, clear ownership and shared evidence.

  • Build capability over time

    Carry decisions and learning forward with a repeatable way to advance opportunities and evaluate results.

How the workflow comes together

Three modules. One connected workflow.

Build the case for the right opportunities, shape a coordinated portfolio plan and validate the outcomes.

Three connected modules carry decisions and evidence forward in the same shared system of record.

One shared system of record.

  1. Opportunity & Business Case

    What is worth pursuing?

    Bring business relevance, technical feasibility, expected value and investment requirements together to build a defensible case.

    Explore Module
  2. Dynamic Roadmap

    What should move forward, and when?

    Coordinate initiatives around priorities, dependencies and available capacity, adapting the portfolio as circumstances change.

    Explore Module
  3. Outcome Realization

    What value are we actually attaining?

    Compare expected outcomes with actual results, giving leadership evidence to scale, adjust or stop.

    Explore Module

Opportunity & Business Case

Establish the expected outcomes, value and investment for an AI use case.

AI Idea Canvas

Turn AI ideas into assessable business opportunities.

A consistent intake structure for every AI opportunity

  • AI Idea Capture
  • KPIs & Related Use Cases
  • Process Analysis
  • Data & Technical
  • Risk Assessment
  • Stakeholders
  • Strategic Alignment
  • Readiness
  • Additional Information

Business contextValue hypothesisAssessment inputs
Structured context for assessment

Complementary Assessments

Assess business relevance and technical suitability.

Technical Feasibility

AIRS™

  • Repeatability
  • Decision complexity
  • Automation fit
  • Data availability
  • Technical readiness

Business Opportunity

AIOP™

  • Strategic fit
  • Business value
  • Sponsorship
  • Customer demand
  • Ethical & legal

Different criteria. A more complete view of the opportunity.

Illustrative assessment profiles

KPI Modeling

Connect performance targets to expected value.

Defect % (or QA Score)

Percentage of items with defects or QA score improvement.

Baseline
9%
Target
2%

Expected improvement

Illustrative KPI configuration · Expected improvement, not an attained result

Investment Modeling

Make implementation effort, cost and timing visible.

Implementation Cost
$97K
Operating Cost
$12K/yr
Implementation Duration
~1 mth

Bring cost, effort and timing into the decision.

Illustrative investment estimates · Cost and duration
Result

Executive Business Case

Expected outcomes, projected value and required investment, brought together for an informed decision.

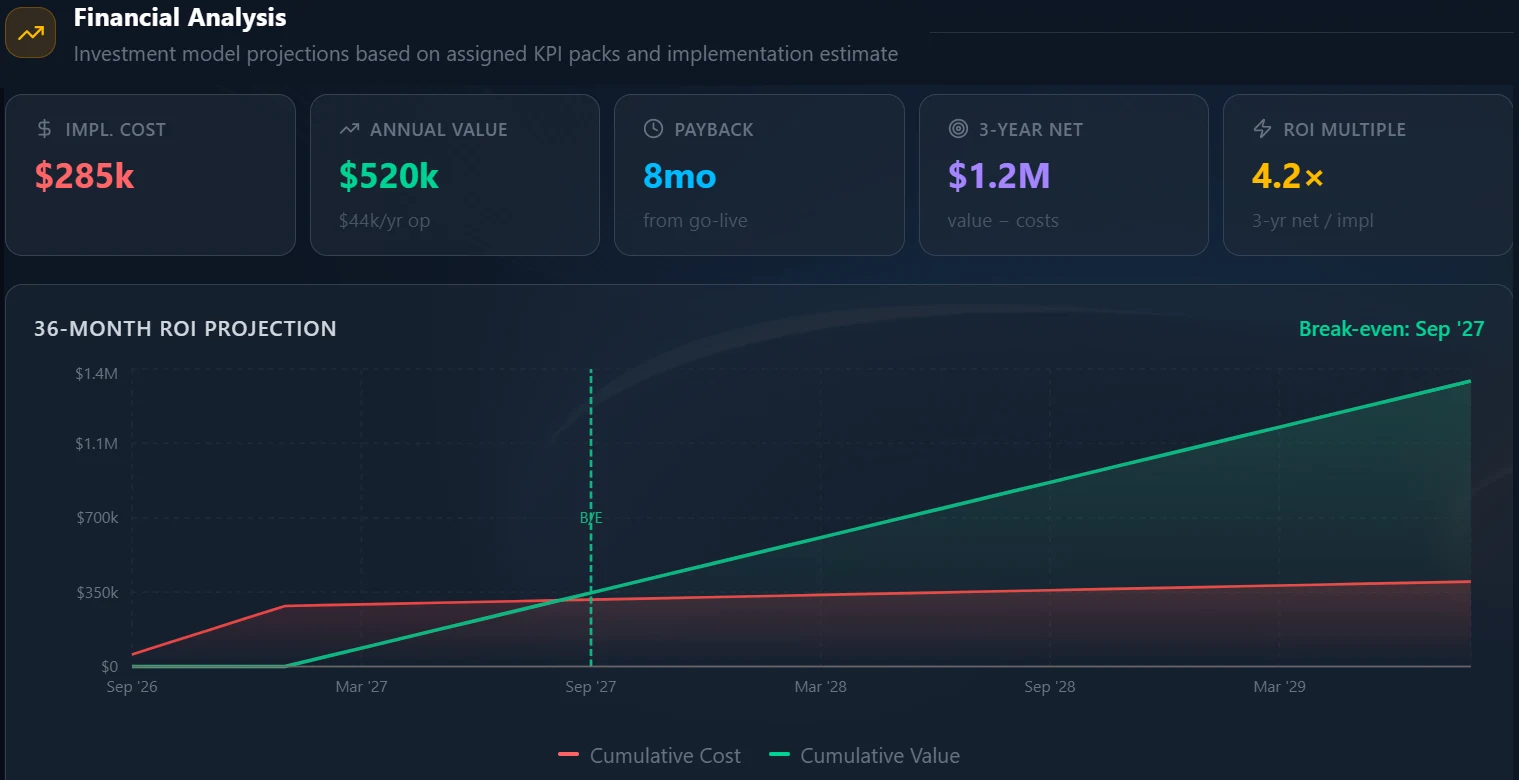
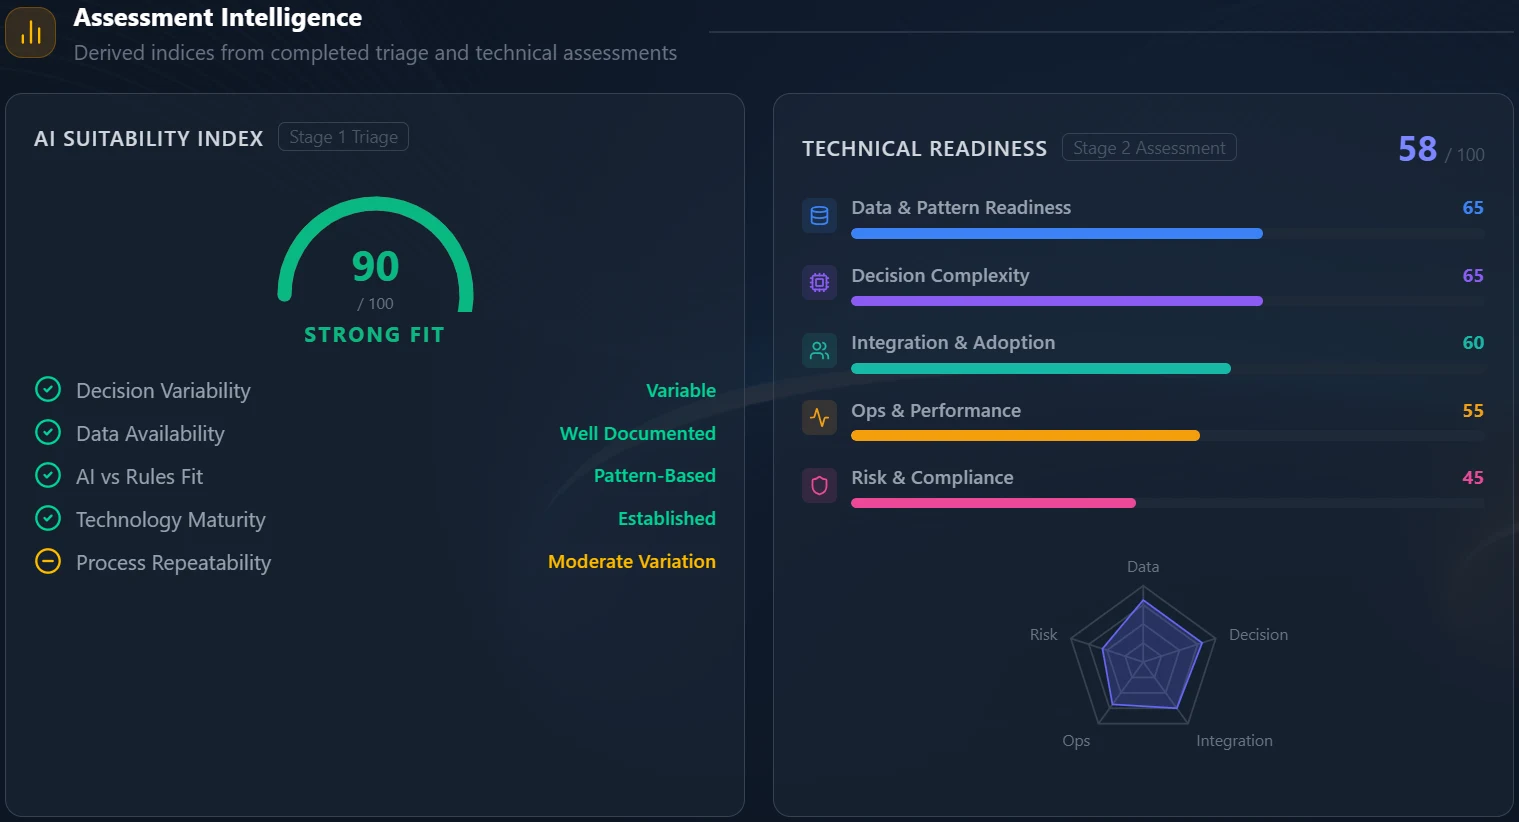
Executive Business Case concept view combines a suitability index of 90 with a technical readiness score of 58 and its supporting assessment categories.Concept financial analysis: implementation cost $285K, annual value $520K, payback eight months and three-year net value $1.2M. These illustrative projections are not measured results.
Concept view · Illustrative assessment indices and financial projections

Product excerpts use separate demonstration records.

Dynamic Roadmap

Build a shared portfolio plan with priorities, timing and investment visible.

Qualified Opportunities

Review qualified initiatives in a common portfolio view.

Prioritized Backlog

  • OPS-UC002Supply Chain Demand Forecasting
  • FIN-UC001Automated Invoice Processing
  • CS-UC005Proactive Customer Churn Prevention
Demonstration view · Illustrative prioritized opportunities

Portfolio Sequencing

Set priorities and timing across planning horizons.

  1. Today – 6 months

    Sep ’26 – Feb ’27

    CS-UC001

    Intelligent Chatbot for Customer Support

  2. 7 – 12 months

    Mar ’27 – Aug ’27

    LEG-UC003

    Legal Document Search and Retrieval

  3. 13 – 18 months

    Sep ’27 – Feb ’28

    FIN-UC003

    Cash Flow Forecasting

Demonstration view · Illustrative planning horizons

Scenario Economics

Compare expected value, cost and portfolio trade-offs.

EST. ANNUAL VALUE
$1.9M
TOTAL IMPL. COST
$435K
3-YEAR NET VALUE
$3.1M
3-YEAR ROI MULTIPLE
7.1×
Demonstration view · Illustrative expected values, not attained results
Result

Portfolio Plan

A shared plan with priorities, required investment and expected value in view.

  1. Reassess Priorities
  2. Explore Scenarios
  3. Review Portfolio Impact
  4. Refine the Roadmap

P2P Navigator

Plan, Prioritize, and Launch AI Initiatives

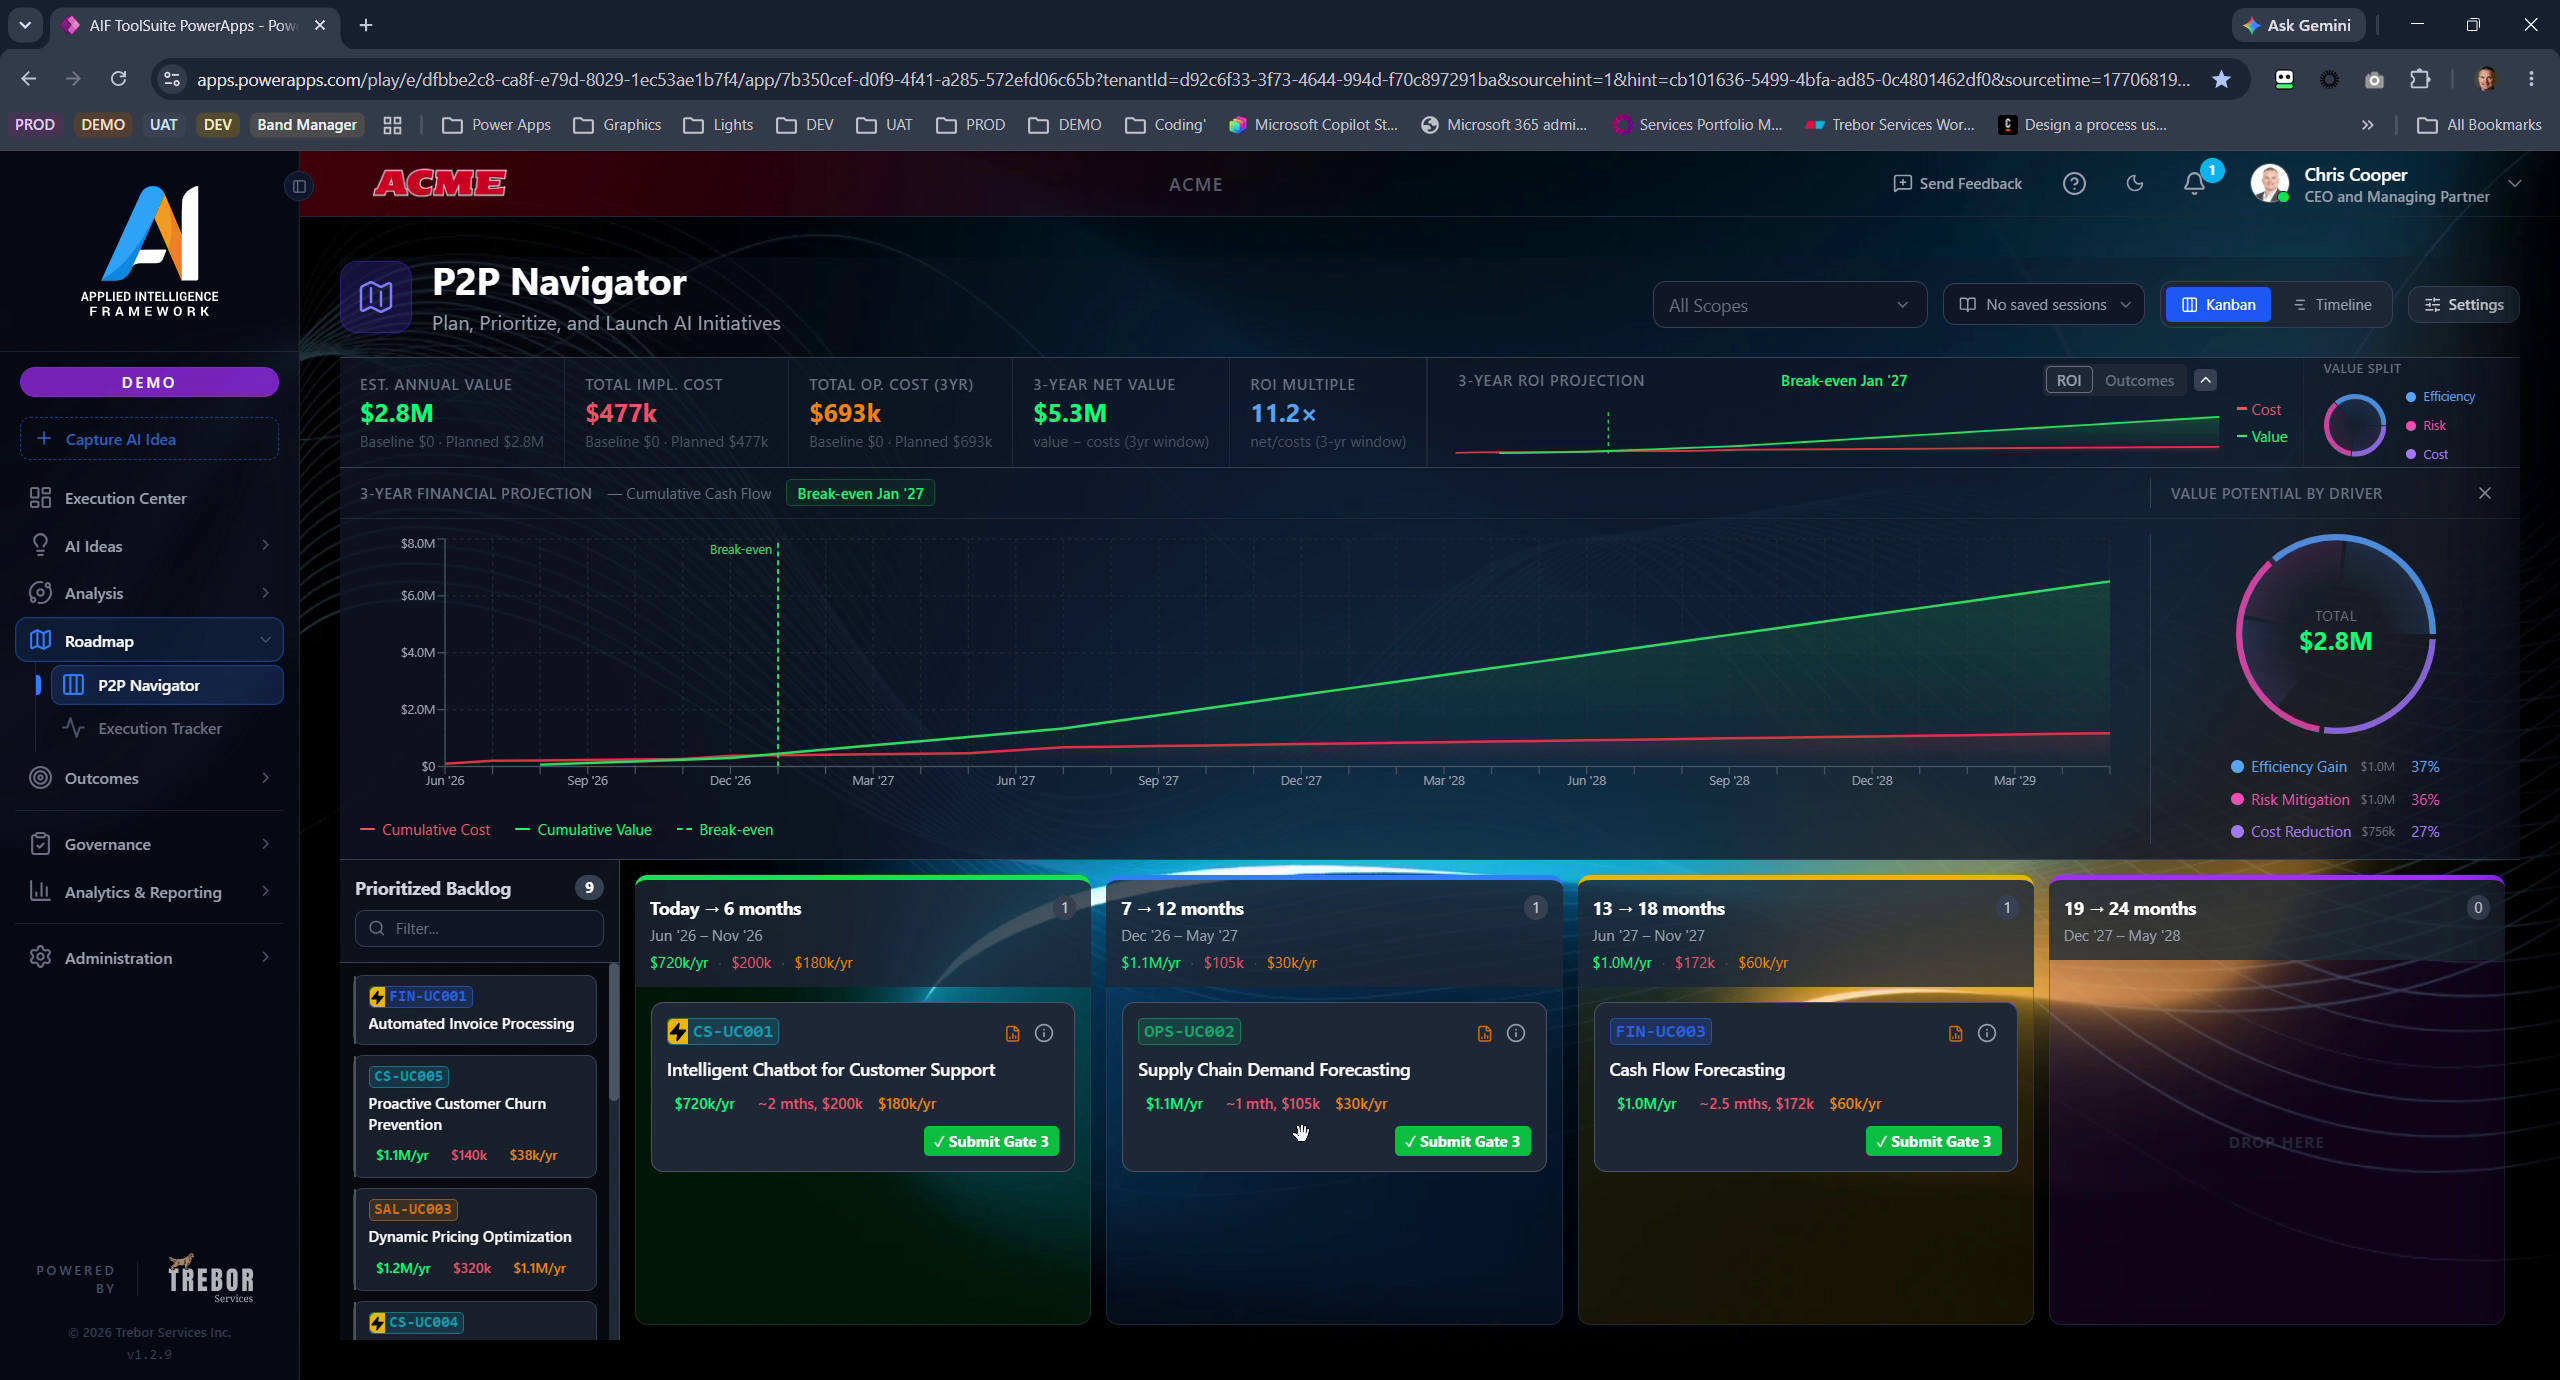
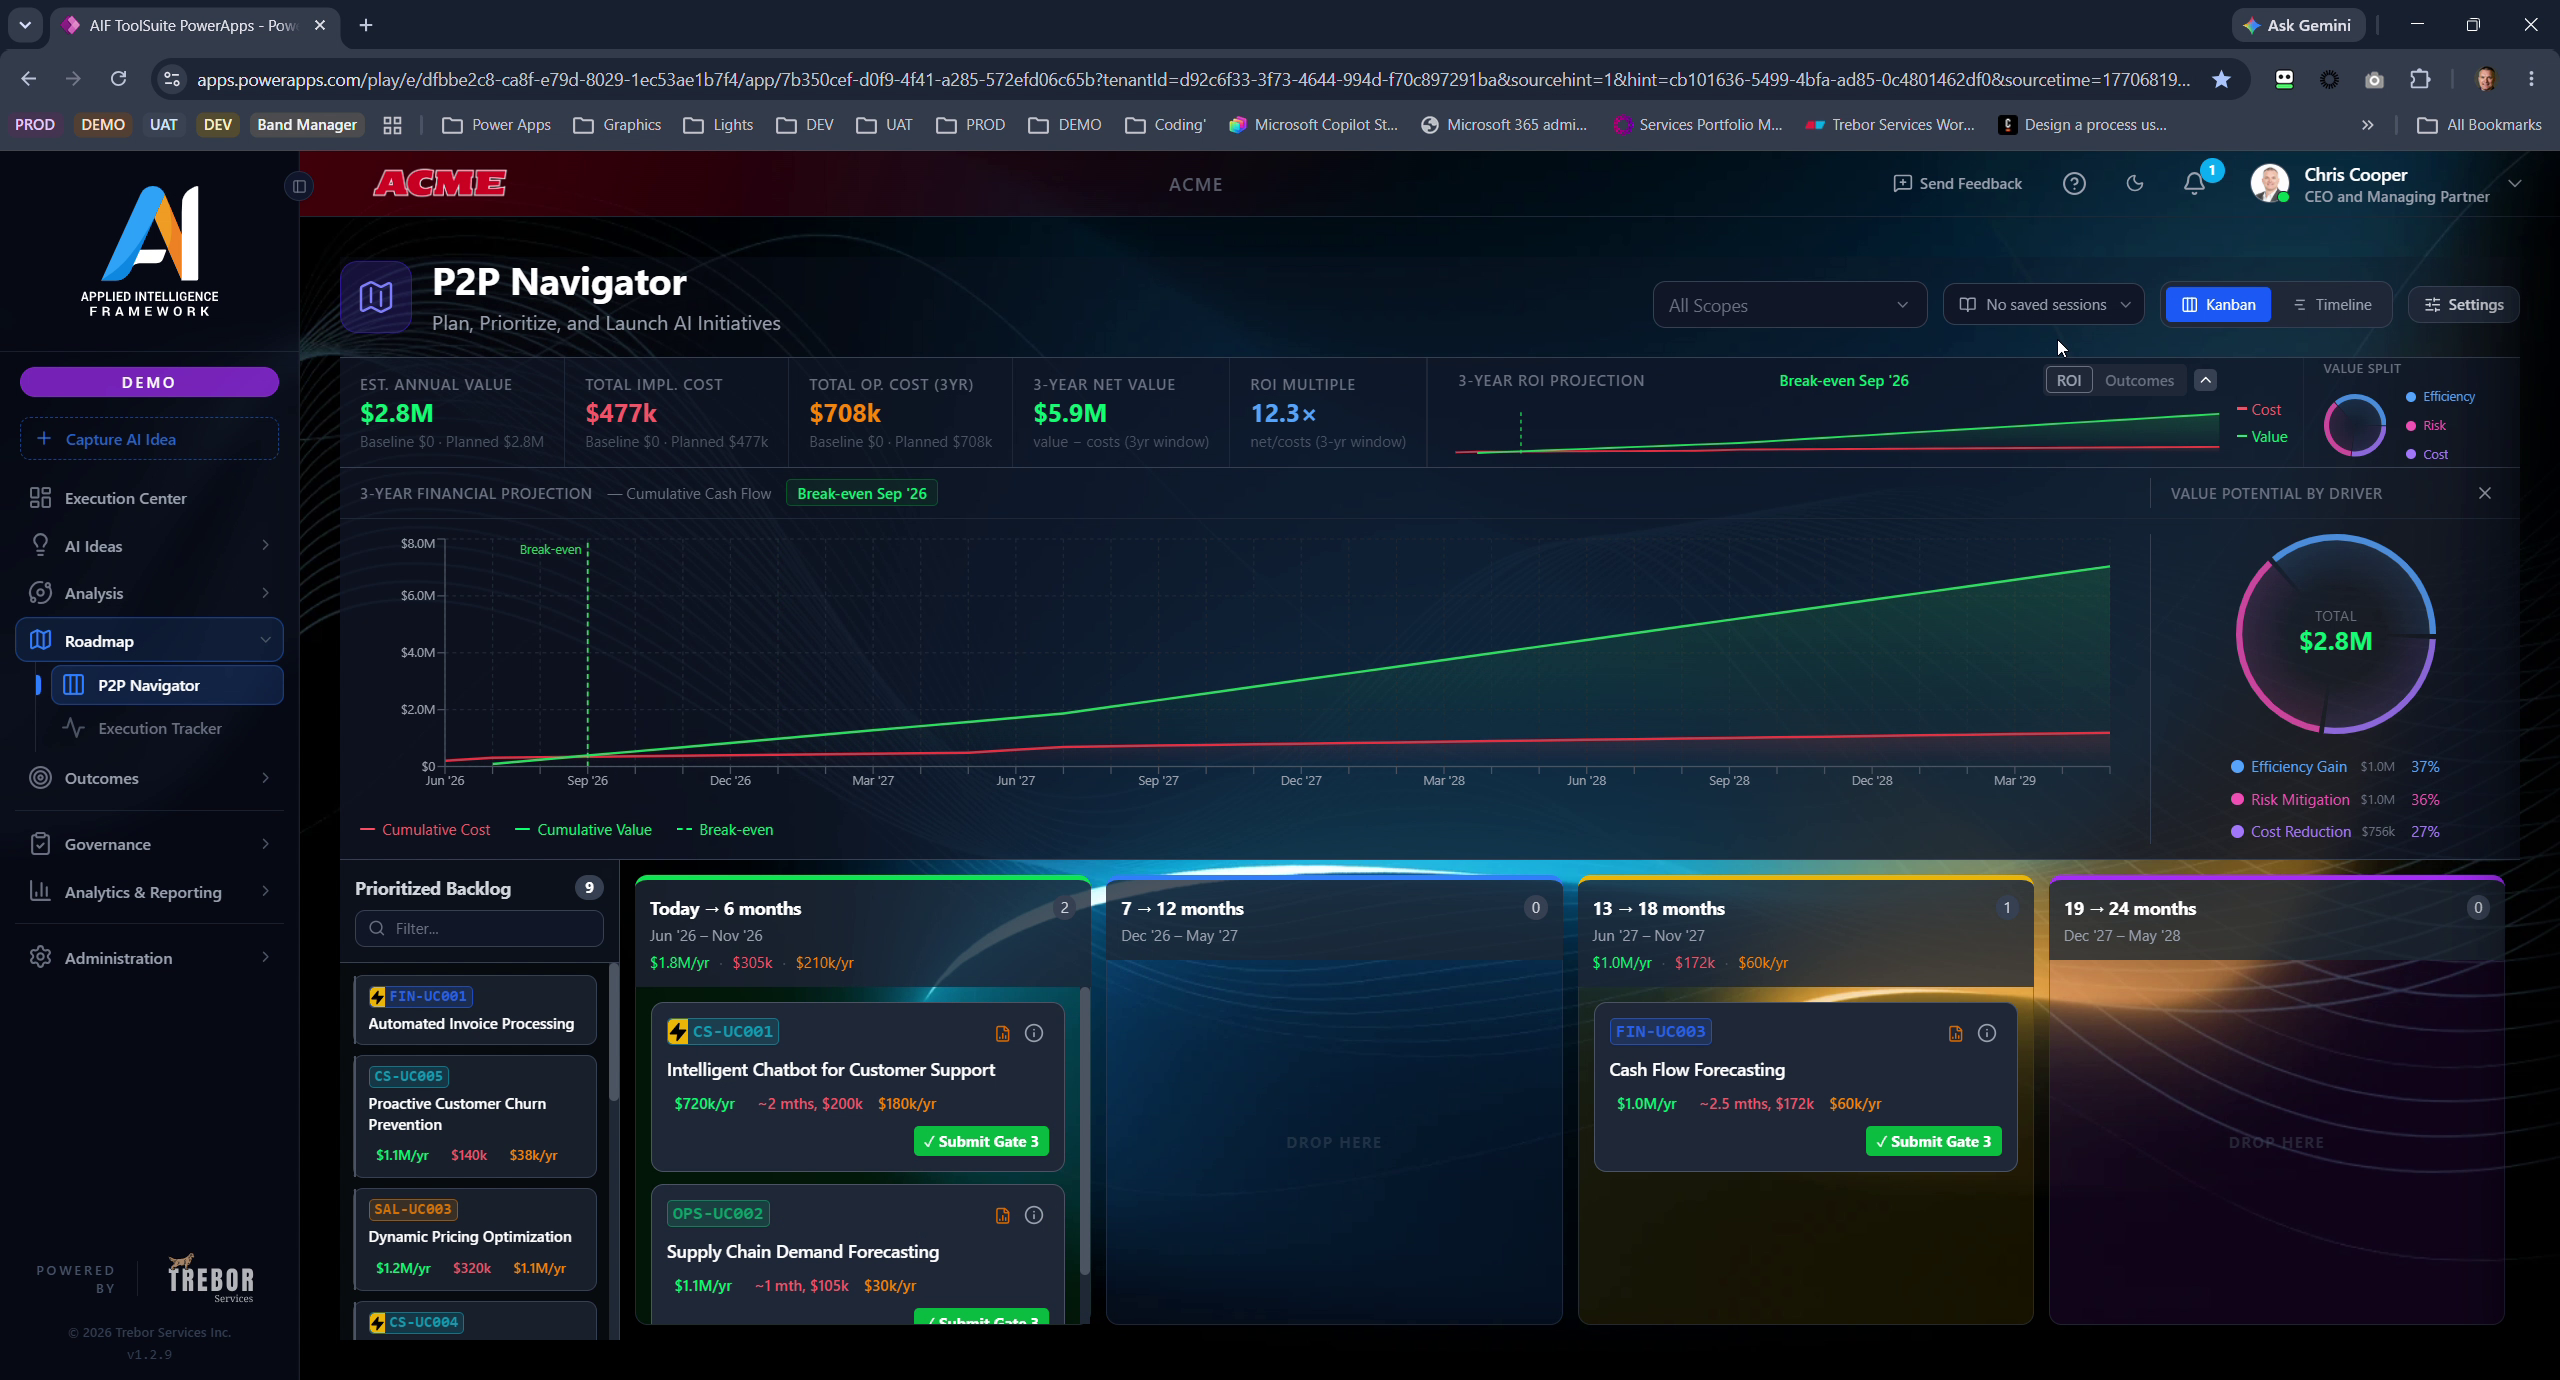
Model value and costs. Test an earlier start. Compare the portfolio’s break-even and expected return.Supply Chain Demand Forecasting: potential annual value $1.1 million, estimated implementation duration approximately one month, one-time cost $105,000, recurring operating cost $30,000 per year. An earlier scenario start changes the portfolio projection: three-year net value rises from $5.3 million to $5.9 million, ROI from 11.2 to 12.3 times, and break-even moves from January 2027 to September 2026. The chart shows cumulative value and costs.

Product excerpts use separate demonstration records.

Outcome Realization

Maintain a shared evidence base for delivery, performance and realized value.

Delivery Progress

Monitor initiative progress through PoC, Pilot and Scale.

Active Initiative
PoC → Pilot → Scale
Demand Forecasting ModelVP Supply Chain
PoC
32 / 56 days
57%Stage Progress
Illustrative active initiative · Stage progress

KPI Performance

Compare observed performance with target criteria.

Forecast AccuracyPrimary
Target (Ideal)
85%
Baseline
70%
Gap
-2.0%

83%Actual

85%Target

Illustrative KPI performance · Observed against target

Value Attainment

Compare projected and realized value, and identify gaps.

Portfolio Summary
Target Realization82%

$4.2Mof $5.1M projected

Projected vs. realized value
Illustrative portfolio report · Projected and realized value
Result

Outcome Evidence

A clear record of performance, realized value and gaps requiring attention.

Business Outcome Validator

Track KPIs and outcomes through PoC, Pilot, and Scale stages

ROI Performance(Portfolio Initiatives)
Illustrative portfolio initiative performance
InitiativeStageProjectedRealizedRealizationStatus
Invoice QC VisionScaled$1.5M$1.4M93%Strong
Customer ChatbotPilot$1.2M$0.3M25%In Progress

Key Risk for Customer Chatbot

Issue: Adoption plateaued at 45%

Root Cause: Training gaps, quality concerns

Warning
Illustrative executive report · Portfolio performance and risk

Product excerpts use separate demonstration records.

THE TOOL SUITE VALUE CHAIN

Build the case. Plan the investment.
Validate the outcome.

The Tool Suite carries the measures and assumptions behind an AI investment from opportunity assessment into portfolio planning and outcome review.

  1. Business case

    Define what success means

    Demand forecasting
    Forecast accuracy target
    85%
    Annual benefits
    $240k
    Investment
    $120k
    Case
    assumptions
  2. Portfolio plan

    Plan when it should happen

    Demand forecasting
    Demand forecastingBenefits
    start
    Year 1 expected benefits$180k
    Expectations
    to validate
  3. Outcome review

    Measure what was attained

    Demand forecasting
    Forecast accuracy:
    Target 85%Actual 83%
    Year 1 benefits:
    Expected $180kAttained $160k
Illustrative value chain · demonstration assumptions and outcomes

TRY THE VALUE LOGIC

From a better process
to measurable potential.

Start with a familiar workflow. Define the operational change, choose an outcome KPI, then model its dollar value.

  1. 01Choose a use case
  2. 02Define the movement
  3. 03Select a KPI pack
  4. 04Model the value

01 · THE USE CASE

Less searching. More time for the customer.

Before replying to a customer, a service agent reviews their request and past interactions. AI brings that information together in a short summary, which the agent checks before responding.

SC-014 · Service-case preparation

Could less preparation time free the team to handle more cases?

Guided example · illustrative assumptions and results.

Concept illustration of three business leaders reviewing portfolio papers together in a blue-lit office with warm orange lighting.

EXPLORE THE TOOL SUITE

Bring your AI portfolio. See the decisions it could support.

Explore how the AIF Tool Suite could connect your business cases, investment priorities, and outcome evidence.

Request a Tool Suite Demo

PRIVACY CONTROL

Privacy Choices

Trebor does not currently use analytics, advertising, or cross-site tracking cookies or similar technologies on this website.

No optional cookies or trackers are currently active.